We’ve all heard of Microsoft Excel – king of the spreadsheet world, used by millions of people for day-to-day business operations.
A lot of people don’t know just how much power Excel puts in the hands of its users.
No matter what industry you’re in, Excel’s powerful tools can give you a snapshot of your business big data, allow you to identify and analyse business trends, make decisions that can lead to greater success, and streamline your business operations, saving you time and money.
Manage people and business records
Day-to-day business can involve large amounts of data for sales, transactions, employees, inventory, and the list goes on. It’s important to keep this data organised and easy to navigate.
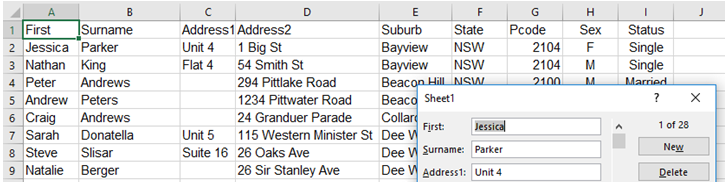
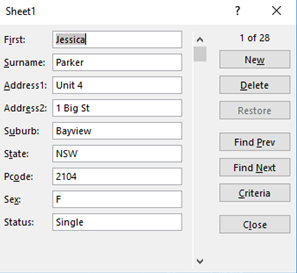
Before you can be great, you have to start with the basics. Use Excel data forms to create business records of any kind.
Using data forms allows you to easily sort and search for your records, keep track of every thing or person that comes into your business, list critical transactions, dates, items, contracts, all of which are essential for accurate analysis and decision-making.
Analyse data & inform decisions
On any given day, data can arrive quickly and in large volumes, and we need tools to be able to make sense of it.
A major goal for any business is to get business data translated into decisions ASAP.
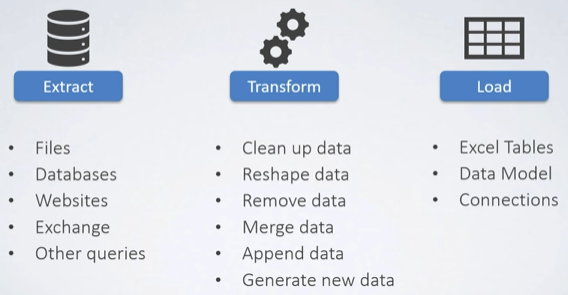
With Excel’s Get & Transform Data tool, you can bring together all the relevant information you need to make fast and smart business decisions.
Connect and interpret your business data
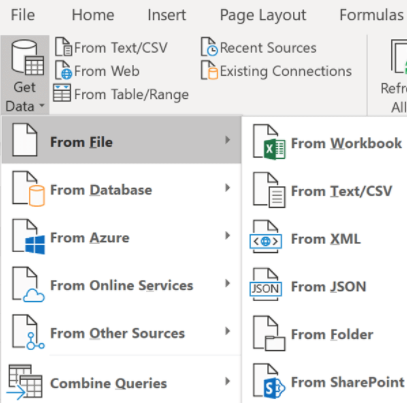
Using Power Query, Excel allows you to import a variety of data sources into a single Excel workbook. For example, you can connect data from your sales database, websites, emails, or even tables in your current workbook, and you’re not restricted by the number of rows in Excel – so you can work with BIG data.
Merging files can save you hours
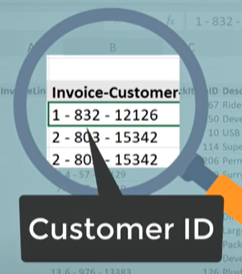
Let’s say you want to create two reports from a big data file: sales by customer group name and sales by customer category. BUT, you don’t have customer group name or customer category information in your file – you only have customer ID, in a messy format, wedged between other numbers.
What do you do? You would have to somehow pull out this customer ID, and look up customer names and categories in a separate file… which might be a text file!
If you don’t have an IT department to get you a copy of this text file as an excel file, you’re looking at hours and hours (maybe even days) of work.
Power query saves the day
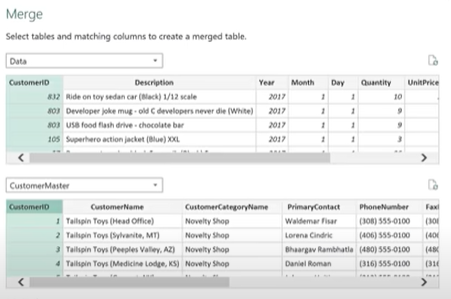
With Power Query, can pull out the customer ID from your big data file, and merge it with the customer file, even in its text form.
Now you’ve learnt which customers (like suppliers for example) spend the most money, and for which products and services.
Without Power Query, you would likely still be calculating formulas just to extract the customer ID.
Learn to manage and analyse your business data
Although it may seem like a lot to take in if you’re new to Excel, and even if you’re familiar with it, but everyone can use these tools with a little bit of training.
Learn Advanced Excel skills with Computer Training Online’s Excel Advanced Training Course and get the Career Academy success tools included for free. Start taking advantage of Excel’s powerful data management and analysis features and you’ll be on your way making smarter and faster business decisions.